
Squeezing Performance out of eBPF
What eBPF hooks, kernel reads, maps, rings, and arenas actually cost, measured across cores.
We've done a deep dive into eBPF, and found that very specific optimizations are required to eke out every cycle of performance. This post shares some of those learnings while introducing this awesome technology.
First, why does eBPF exist? A core motivation is that writing kernel code is hard. It has to integrate well with the millions of lines of complex existing code. This is made all the more difficult by kernel-specific challenges: interrupts that complicate blocking, access to user-level memory referenced from potentially malicious user pointers, and a complicated memory model that enables the magic of RCU. Most importantly, the stakes are high. A fault in kernel code takes down all processes executing on the system.
Just as managed language environments (e.g. Java, C#) use language VMs that provide an execution environment that abstracts away many of the complexities of the underlying system, the Linux kernel supports eBPF as a VM-of-sorts. eBPF code executes in the kernel in a sandbox to prevent many errors, and ensure that the rest can't bring down the system. The sandbox enables only limited access to kernel structures and core APIs, and will only load code it can verify has specific properties.
This article focuses on the performance of the core eBPF APIs and operations. These often define what is possible when using eBPF. eBPF "democratizes kernel code", and has a huge number of uses that go beyond the original BPF's packet filters:
- It is a powerful scope into what's happening in your system, given everything from flame graphs to event counts.
- It provides the foundation for container and Kubernetes networking.
- It is used to enforce security policies in the kernel through BPF LSM hooks (the older seccomp filters still use classic BPF).
- It has been shown to scale up to even a full in-memory database!
- Finally, eBPF is a core technology for modern security products that need to exactly understand what the kernel is doing.
The eBPF Execution Model
How does an eBPF program execute? The eBPF execution model includes:
- eBPF is an instruction set (standardized as RFC 9669) with backends in both LLVM and GCC, so languages such as C and Rust can compile to eBPF. This enables writing eBPF programs in familiar languages. Complicated issues like supporting multiple kernel versions (with potentially different structure layouts) are taken care of by CO-RE relocations driven by BTF.
- eBPF programs hook onto existing kernel functions, and execute directly in the kernel. This means that eBPF programs can execute during a vast number of kernel events. It does so while completely avoiding hardware mode switches (i.e. system calls).
- Read-only access to the kernel image including all of the kernel data-structures, which means that eBPF can be used to massively increase observability of the kernel. For example, eBPF programs can parse data-structures like
struct task_structs to understand and report thread-specific data. - eBPF programs can modify only a very limited set of data through explicit helper functions. While there's a long list of these helpers, most eBPF programs fundamentally rely on maps and ringbufs. Maps are hashtables with the traditional lookup from key to value, update, etc... Ring buffers enable the allocation of chunks of memory in the ring buffer. Both of these abstractions have user-level libraries that can perform comparable operations on the maps, and read data out of the ring buffer.
- eBPF programs are executed safely, despite being run in the kernel, as they must pass a restrictive verification step before being installed. While the verifier has changed quite a bit over time, it always ensures that the program only modifies its own register values, and values exposed from eBPF data-structures. You can think of the verifier as providing the rough equivalent of bounds-checking for the data provided by the helper APIs. [1]
eBPF Performance
We care deeply about eBPF performance as it places a bound on how much of an impact eBPF programs can have on the system. Anyone who has to extend the kernel to better understand its execution properties has to balance various options, including eBPF. In our case, we want to track all causal relationships between system abstractions including processes, files, and network connections, so we care deeply about the performance impact of that tracking.
We designed our use of eBPF around its performance properties. We expect that the performance of key operations is interesting to anyone considering the use of optimized eBPF. We investigated these questions:
- How much overhead does hooking have? If hooking is expensive, then everything is!
- How much overhead does establishing timestamps have? When observing kernel execution, many eBPF programs leverage timestamps to order operations.
- When accessing data-structures in the kernel from eBPF, how much overhead can we expect?
- What are the overheads of the map APIs for various types of eBPF maps? Since maps are the foundational means to persist state across eBPF programs, we have to know their impact.
- What are the overheads of ring operations in various scenarios? Rings are pervasively used to pass observations up from the kernel to user-level, so their performance is important.
For all of the above, we want to understand not just their straight-line performance on a single core, but also how their performance scales with increasing numbers of cores. This may not be obvious, but many of these mechanisms require shared state -- thus locks, RCU, and, in some cases, Inter-Processor Interrupts (IPIs). As such, performance with these complexities changes with increasing cores.
Hooking, syscalls, and time
What is a hook, and how is it implemented? Let's assume that we want to add an eBPF program that is called whenever the getpgid function is invoked. For simplicity, I'll assume an x86-64 kernel built with the function tracer (CONFIG_FUNCTION_TRACER, which compiles with gcc's -mfentry).
:
  0:  0f 1f 44 00 00         nopl  0x0(%rax,%rax,1)   ; noop does nothing
  5:  55                     push  %rbp
  6:  48 89 e5               mov   %rsp,%rbp
  9:  41 54                  push  %r12
  ...
The normal, unhooked function has a noop at its head that does nothing. And after hooking:
:
  0:  e8 *_tramp_addr        call trampoline
  5:  55                     push  %rbp
  6:  48 89 e5               mov   %rsp,%rbp
  9:  41 54                  push  %r12
  ...

:
  ; push arguments onto stack
  call  ebpf_hook                     ; call the ebpf program!
  ; pop args off stack
  ret                                 ; return back to do_getpgid
These core facilities in the kernel for hooking on kernel functions impose unavoidable overhead. For a minimal overhead system call (getpgid, a trivial PID lookup with no vDSO fast-path or user-level caching to get in the way), what overhead can we expect?
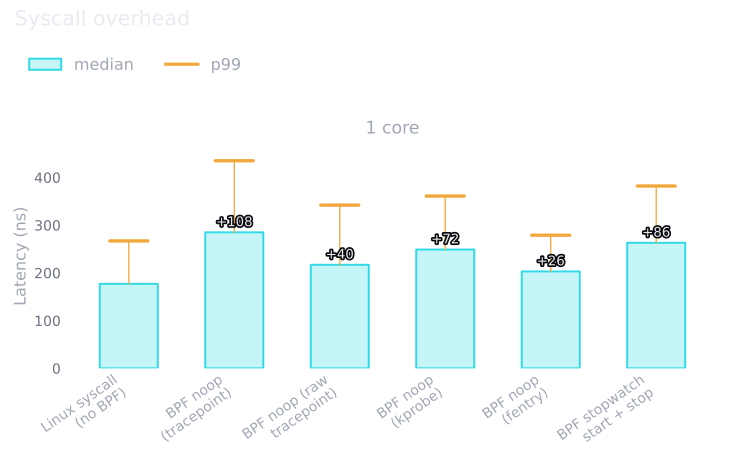
This shows the median and 99th percentile overhead for
- a normal, fast
getpgidLinux system call, - hooks using tracepoint, raw tracepoint,
kprobe, orfentrymechanisms, and - fentry plus taking a couple of timestamps.
Tracepoints, raw tracepoints, kprobes, and fentry are four different hooking mechanisms provided by the kernel. Tracepoints are statically defined in kernel code, and are stable across kernel versions. They are at pre-defined locations (e.g. each system call) -- see your system's tracepoints in /sys/kernel/tracing/available_events. They define the structure of the arguments passed to the hook, which requires the kernel to marshal the arguments into that format before presenting them to the hook. For example, the arguments for getpgid are spelled out in /sys/kernel/debug/tracing/events/syscalls/sys_enter_getpgid/format.
An example of what a tracepoint program looks like:
struct getpgid_args {
	uint64_t common_args[2];
	pid_t pid;
};

/* hook onto the entry point in the getpgid syscall */
SEC("tp/syscalls/sys_enter_getpgid")
int sys_enter_getpgid_tp(struct getpgid_args *ctx)
{
	bpf_printk("pid argument %d", (unsigned int)ctx->pid);

	return 0;
}kprobes can hook onto any function, including system calls! Their context is just the saved registers (struct pt_regs) -- no function-specific types at all.
/* hook onto the first instruction of the syscall implementation */
SEC("kprobe/__x64_sys_getpgid")
int BPF_KPROBE(getpgid_kprobe, struct pt_regs *regs)
{
/* expands to bpf_probe_read_kernel(..., ®s->di) */
pid_t pid = (pid_t)PT_REGS_PARM1_CORE_SYSCALL(regs);
bpf_printk("pid argument %d", pid);
return 0;
}Remember in the assembly when the trampoline had to push registers onto the stack? Here we see the cost of not knowing the type of the function being hooked: we're pushing an entire set of registers (pt_regs)! This is not free.
The comparable fentry program does better: BTF describes the signature of every function the kernel exposes for tracing, so if we hook do_getpgid, only the pid argument is pushed onto the stack in the trampoline. Types are powerful!
/* hook onto the function the syscall wrapper calls */
SEC("fentry/do_getpgid")
int BPF_PROG(getpgid_fentry, pid_t pid)
{
	bpf_printk("pid argument %d", pid);

	return 0;
}
This avoids the generic pt_regs and associated casts. Similar to how DWARF can understand your C program's types, BTF enables the verifier and JIT compiler to understand the function's type signature and type layouts. This is not just convenience. For fentry, only the function's types need be available, whereas the other approaches require serializing the entire pt_regs onto the stack!
I simplify the above description of kprobes. Previously, they didn't require the compiler-inserted noops at function heads and instead inserted int3 instructions that caused full hardware exceptions on each hook (these are still used in uprobes). These are so slow that I didn't include them.
| Kernel version availability | Efficient argument access | Efficient hooking | |
|---|---|---|---|
kprobes (int3 trap) | 4.1 | ✘ | ✘ |
kprobes (ftrace site or optprobe) | 4.1 | ✘ | ✔ |
| Tracepoints | 4.7 | ✘ | ✔ |
| Raw tracepoints | 4.17 | ✔ | ✔ |
fentry | 5.5 (x86-64), 6.0 (arm64) | ✔ | ✔ |
We can see that the kernel version availability is really one of the key trade-offs here.
The last column in the graph inserts a pair of bpf_ktime_get_ns calls that enable us to keep time. It might be surprising that the cost of these timekeeping operations is so significant, 60ns in this case. The cost of the rdtsc instruction on most x86 architectures is around 30 cycles, and the serializing variant (rdtscp) is even more. The cost of a multiplication and shift to convert cycles to nanoseconds explains the remaining costs. Even tracking the CPU's notion of time isn't free!
Design guidance
- Use fentry where available. These results give pretty strong guidance to use
fentrywhere possible, and to avoid taking redundant time measurements where possible. - Hooks are fast! The results indicate that for anything other than the most frequently invoked hooks, the overhead is negligible.
- Time isn't free. While not a huge expense, simply getting the current time is not free. Save and reuse time readings where possible.
Reading kernel structures in eBPF programs
eBPF's observability superpower is walking kernel data-structures, and there are two mechanisms for it. The portable workhorse is BPF_CORE_READ:
ino = BPF_CORE_READ(task, mm, exe_file, f_inode, i_ino);This looks like a single operation, but it expands into a helper call per pointer hop (with each field offset CO-RE-relocated to the running kernel):
struct mm_struct *mm;
struct file *ef;
struct inode *in;
unsigned long ino;

bpf_probe_read_kernel(&mm,  sizeof(mm),  &task->mm);
bpf_probe_read_kernel(&ef,  sizeof(ef),  &mm->exe_file);
bpf_probe_read_kernel(&in,  sizeof(in),  &ef->f_inode);
bpf_probe_read_kernel(&ino, sizeof(ino), &in->i_ino);
Each bpf_probe_read_kernel is a real function call into the kernel that range-checks the address and performs a fault-guarded copy through the stack. The alternative, in BTF-aware program types (fentry and friends) where pointers carry their types, is the "direct memory dereference":
ino = task->mm->exe_file->f_inode->i_ino;The same CO-RE relocations (guided by BTF) are present, but each hop compiles to a single load instruction. The JIT registers that load in an exception table so a faulting read yields NULL. The safety is identical -- but the guard is free on the (overwhelmingly common) non-faulting path, rather than paid in call overhead on every hop.
In both forms, a bad read doesn't fault the program -- it silently yields NULL. Behind the scenes, the kernel is doing two things to make this work.
- An explicit address-range check rejects user-space/
NULLaddresses up front (at the cost of a branch). Since 6.9 the verifier inserts this check as extra BPF instructions; before that, the JIT emitted it. This prevents the worst outcomes of silently accessing user memory. - If the accesses are made within the kernel-range of addresses that fault, the page-fault handler recovers the access (in a manner similar to how
copy_from_userworks).
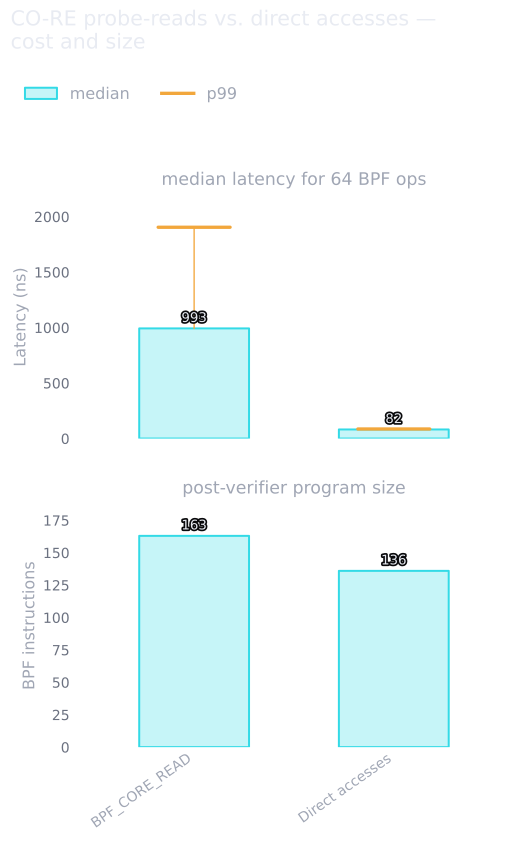
The measurement is the same 4-hop walk above executed 64 times, as its own program per mechanism. Dividing the medians by the 64 walks: one task->mm->exe_file->f_inode->i_ino walk costs roughly 16ns via BPF_CORE_READ (~4ns per hop, each hop a helper call) versus roughly 1.3ns dereferenced directly -- a ~12x gap, all of it per-hop call overhead. The program-size gap (4 call sites vs. 4 loads per walk) also feeds the verifier's complexity budget.
A challenge with the BTF-guided direct memory dereferences is that the verifier must understand the type at each step in the dereference chain. The verifier tracks types for its abstract registers and for full, aligned 8-byte spills of them to the stack; a typed pointer that goes anywhere else (a partial or misaligned spill, or a store into map memory) comes back as an untyped scalar and cannot be used for further direct dereferences. More about this when we discuss verification in a future article.
Design guidance
Dereference directly where the program type allows it. In fentry/tracing programs on BTF-typed pointers, chain walks cost a branch and a load whereas BPF_CORE_READ additionally costs a call. When BTF is available, leverage its benefits!
eBPF maps
While maps are a simple data-structure, they are pervasive in eBPF and can enable some pretty complex use-cases. They've even been used to implement an in-memory database. They come in multiple flavors:
- hashmaps -- maps from keys to values,
- arrays -- maps from integers to values,
- per-CPU arrays -- arrays with separate per-core visibility, and
- many more.
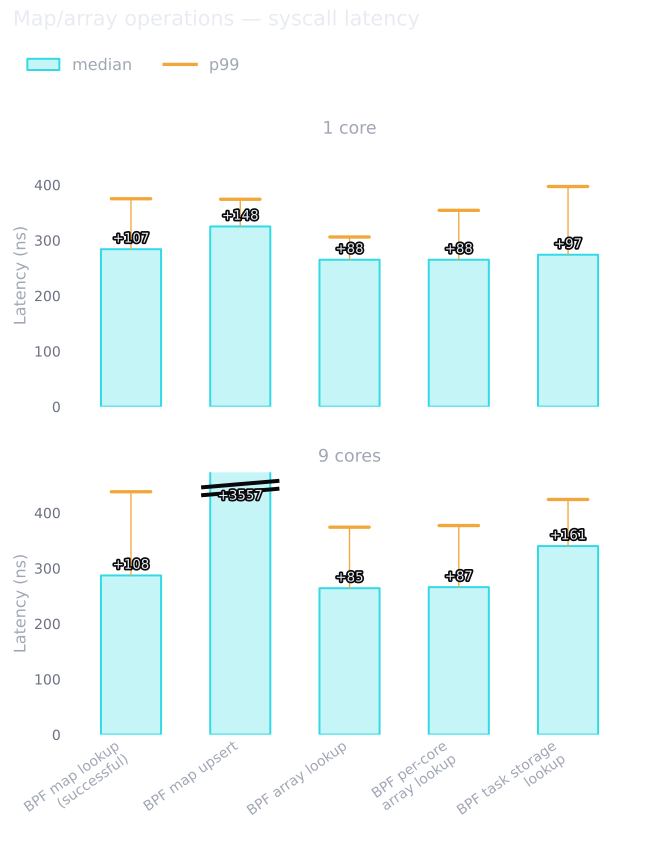
Each of these bars represents the overhead of performing a single operation in a hook on the system call. Each of these bars has a "+x" value above the bar, which is the nanosecond overhead over the unhooked, normal system call. Looking at the top set of bars ("1 core") we can see that all operations are relatively cheap, with the potential exception of upserts (i.e. updating a value in the data-structure with bpf_map_update_elem).
The bottom set of bars is the same measurements, but with the workload split across 9 cores. This means that any operations that require synchronization for parallel operations will increase in cost. We see that here! While most operations are roughly on par with the single core costs, we can see that the upsert overhead blew up! Let's look at that a little more.
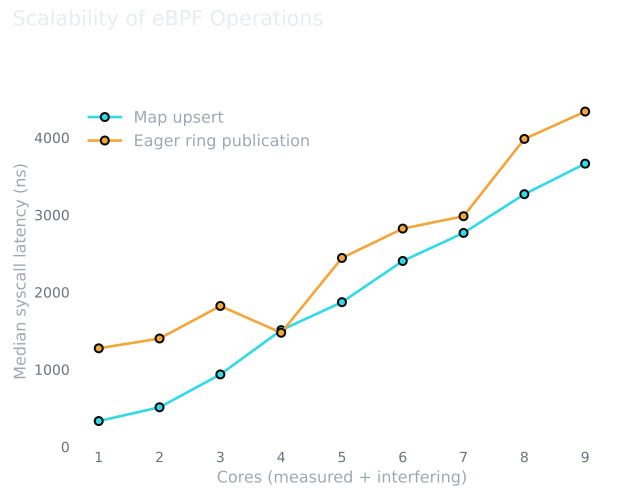
This shows a more granular approach to understanding scalability, where we can see the evolution of the cost as we increase cores. We haven't seen the result yet, but this also shows eager ring activation. Both of these results show that if we care about performance on multicore systems, paying attention only to straightline costs on a single core is insufficient.
These results should be a little surprising. Not necessarily that the upserts increase in cost, but that the other results don't! If you've ever used a concurrent hashtable (e.g. a DashMap in Rust), you might know that they scale well, but that they do increase in cost when going over a single core. They often stripe the hash-space across multiple locks, which implies additional locking overhead -- at least atomic instructions. eBPF maps leverage the kernel's support for RCU to avoid this on the lookup-side fastpaths. Very impressive!
The figures also include task-local storage (BPF_MAP_TYPE_TASK_STORAGE). Rather than a table keyed by thread id, the value hangs directly off the thread's task_struct: bpf_task_storage_get on the current task chases a couple of pointers instead of hashing a key, making it a natural home for per-thread state carried across hooks. Structurally it is the per-thread analogue of the per-CPU array -- state private to the executing context -- and the in-program stopwatch (two bpf_ktime_get_ns calls around the operation) agrees: ~13ns per lookup versus ~10ns for the per-CPU array (a pointer chase and map-match check versus per-cpu address arithmetic), with both flat from 1 to 9 cores. The figure above measures the whole system call, though, and there task storage costs more than the stopwatch suggests: 274ns rising to 340ns at 9 cores, against a flat 265ns for the per-CPU array, so part of its cost lands outside the operation itself. The first use of task storage also has a spike when the value is associated with the task.
Design guidance
- Upserts are expensive. Avoiding
upsertswhere possible is necessary to maintain high performance, especially with increasing numbers of cores. Luckily this can be done by leveraging lookups, and directly updating the values. This gets complicated quickly, though: multiple cores might be accessing the value at the same time, so all such updates must carefully synchronize not only with other updates, but also with parallel accesses. Practically, this means that our core global hash-tables avoidupserts, and employ non-blocking algorithms for updates[2]. - Use arrays where possible. While we use arrays to save ~7ns per lookup over hash maps where possible, the good news is that the eBPF maps of all varieties are quite fast for lookups.
eBPF rings
A core requirement for most eBPF applications is that the eBPF code in the kernel can pass its processed and filtered observations about the kernel to user-level for further processing. This capability is integral to most security applications that wish to understand the details of system execution. Bounded ring buffers provide the core of this functionality.
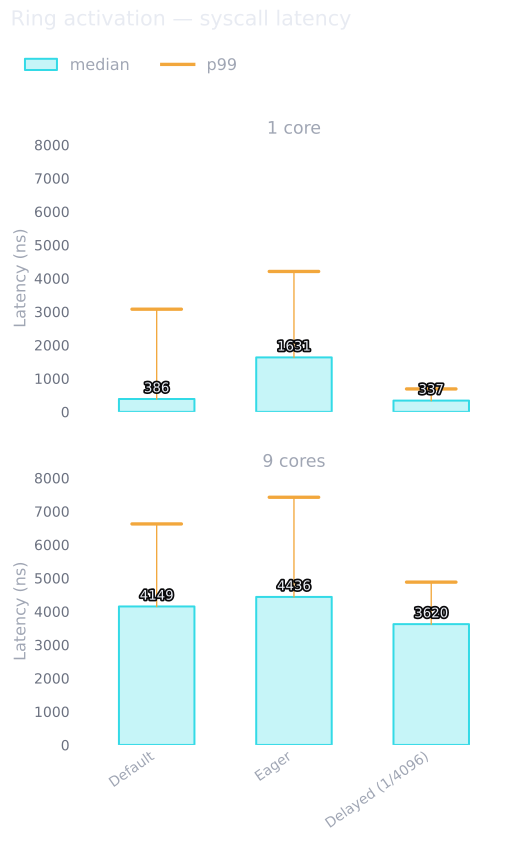
Within the kernel, the core operation is to enqueue data into the ring. This enqueue operation is typically through the pair of bpf_ringbuf_reserve and bpf_ringbuf_submit. The ring buffer is protected with a lock in the kernel (to synchronize for parallel reservations), so we'd expect to see increasing costs for this operation as we increase in core-count. Indeed, we see the measurements for 1 core being drastically less than for 9 cores, and most of this overhead is lock contention, and cache-line bouncing.
When submitting the data into the ring, the flags argument carries an indicator for whether the event associated with the data should be delivered to the user-level thread eagerly (immediately), should be delayed till a future call, or some intelligent combination of both, the default behavior. This simple flag has large implications on performance. To understand why, we have to dive into how Linux handles cross-core notifications. If the user-level thread awaiting ring data is executing on another core, an event must wake it up. But it isn't straightforward to implement that. What if another thread is currently running on that core? What if the thread we're sending the event to is currently being updated by the scheduler on that core?
So this cross-core event notification can be quite expensive: requiring taking locks (e.g. to add the thread to the remote core's runqueue), and sending Inter-Processor Interrupts (IPIs). The latter is more expensive than I'd wish: sending IPIs is a synchronous operation on LAPIC hardware, and receiving the IPI on the target event's core is a heavyweight interrupt. These costs are visible in the default and eager bars, but they land in different places. The default policy only sends a wakeup when the consumer has already drained everything ahead of the new record, so its median stays within ~15% of delayed at both 1 and 9 cores while its 99th percentile is 4.5x delayed on a single core. Eager pays the wakeup on every submit, so its median jumps too (4.8x delayed on a single core). So we should all use delayed events, right?
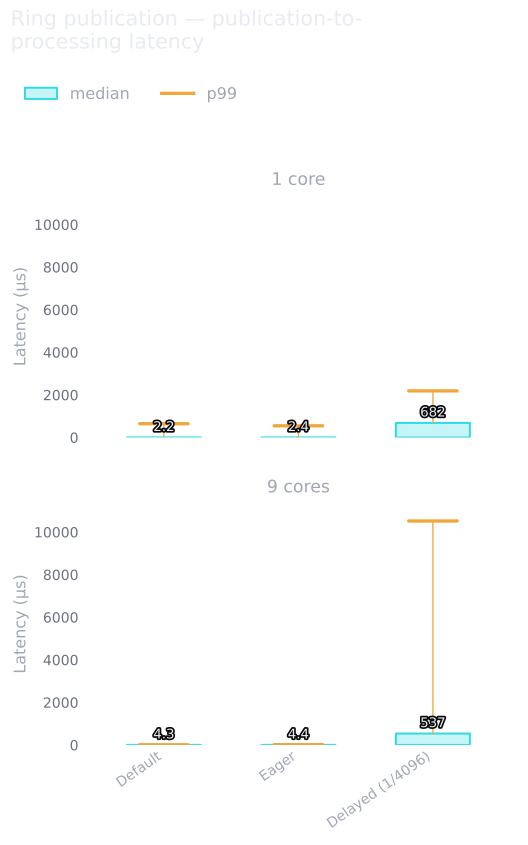
No. The overhead of publishing the events is one factor, but another important factor is how long it takes to deliver the event to the user-level process that consumes the data from the ring buffer. Note that the overheads for these operations are in microseconds instead of nanoseconds. The intuition is that if we eagerly push data to the ring in the eBPF program, we should see it faster than if we delay pushing[3].
These results show that the trade-off is really between tail enqueue cost and delivery latency; on the median, the default policy already sits at a good point.
| Minimal median overhead? | Minimal tail (p99) overhead? | Reasonable event delivery latency? | |
|---|---|---|---|
| Delayed | ✔ | ✔ | ✘ |
| Default | ✔ (within ~15%) | ✘ | ✔ |
| Eager | ✘ | ✘ | ✔ |
Design guidance
- Beware of too-frequent event notifications. While the default ring policy does decently well, without requiring any bespoke logic for sending events, managing how frequently events are sent can have a significant impact on ring operation overheads, and on event delivery latencies. We design ring interactions with this in mind by explicitly rate-limiting event notifications -- an optimization that removed 20% overhead!
- Ring-buffer enqueue contention. The lock overhead for using ring operations on 9 versus 1 core is also significant. We've experimented with using multiple rings to decrease this overhead, but doing so complicates causal reasoning. With this, a timeline of events is now split between multiple rings, and must be reconstructed at user-level. This is on the roadmap.
Dynamic data-structures
Maps and rings have taken eBPF pretty far, but for complex data-structures, they are challenging to compose. If we wanted to use more complex data-structures, there are two general options.
- Kernel-managed data-structures:
bpf_obj_new/bpf_obj_dropallocate typed, verifier-owned objects that link into kernel-provided linked lists (bpf_list) and red-black trees (bpf_rbtree). These leverage the kernel's actual data-structures, so benefit from the efficiency therein. Unfortunately, the verifier requires that each operation must be wrapped in abpf_spin_lock. - Self-managed data-structures: arenas (
BPF_MAP_TYPE_ARENA) enable dynamic page allocation/deallocation, and the full eBPF-program managed memory within those pages. As such, we can implement a memory allocator using arenas, and implement our own data-structures! Arena allocation itself is page-granularity (bpf_arena_alloc_pages); anything finer -- an object allocator, a list -- you build yourself, along with its synchronization.
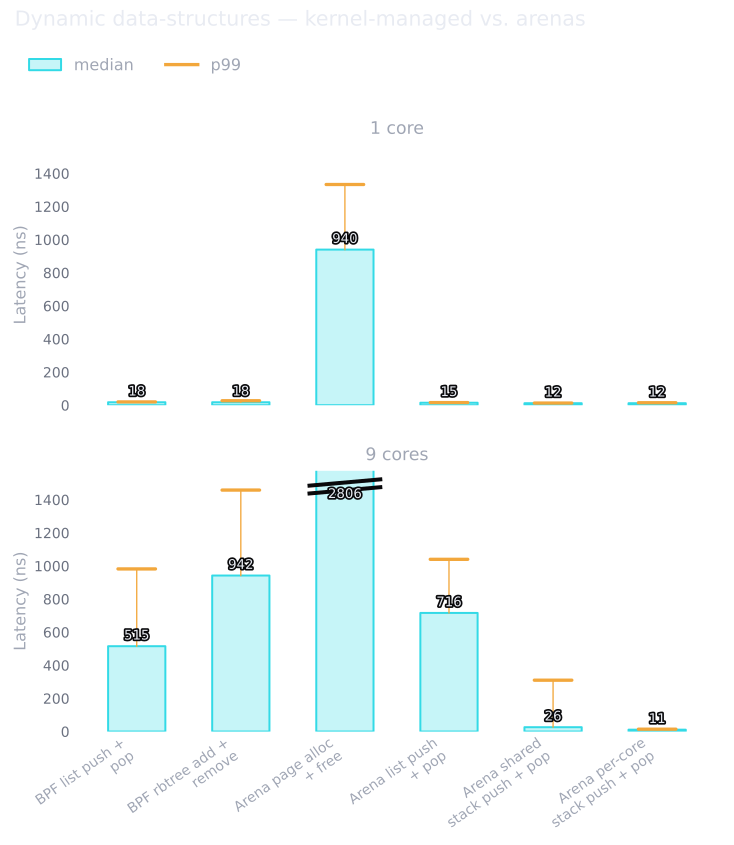
The object-granularity operations all land within a few nanoseconds of each other -- tens of ns whether the kernel manages the structure or the program does -- while arena page allocation is ~60x an object operation: real arena code carves pages into an object allocator rather than calling the page allocator per object. The bottom set of bars (9 cores) shows the cost of sharing: these structures (unlike the maps above) sit behind a single bpf_spin_lock, so contended cores serialize -- the locked structures jump ~29-52x (list push+pop 18 to 515ns median, rbtree add+remove 18 to 942ns, the lock-guarded arena list 15 to 716ns). In contrast, arenas can provide synchronization in any way they choose. In these results, we use a simple per-core Treiber stack with limited retries (to make the verifier happy) to demonstrate a lock-free option, along with a shared Treiber stack to demonstrate shared data-structure overhead. [4] As expected, the scalability properties are strong: the shared stack's CAS-based push+pop costs 26ns median against 716ns for the lock-guarded arena list, and the per-core stack costs don't increase at all (12ns at 1 core, 11ns at 9). This mimics the kernel-native allocator costs for bpf_mem_alloc. Lock-free helps even when shared, but per-core stacks scale perfectly, as you'd expect.
Availability and hook restrictions are key trade-offs. Availability:
| Kernel version availability | |
|---|---|
bpf_obj_new/drop, bpf_list | 6.2 |
bpf_rbtree | 6.3 |
| Arenas | 6.9 (and LLVM/clang 19 to build) |
The hook restrictions include:
bpf_spin_lockis rejected inkprobe, tracepoint, raw tracepoint, and perf-event programs, so the kernel-managed structures are limited tofentry/fexit, LSM, networking, and syscall-style program types, and- before 7.0,
bpf_arena_alloc_pagesallocation was sleepable-only, which drastically limited the hook-points available (e.g. LSM or system calls); 7.0 made the arena kfuncs safe to call from any context.
Arenas use a sparse memory region that can be shared with user-level. It is mmap-able, and pointers are valid across user-mappings and the kernel. While this likely doesn't replace rings (as they provide event notification as well), it is amazingly powerful!
Design guidance
- Arena pages have all the overheads of vmalloc and buddy allocation -- cache and write your own allocator! Avoid page-allocations, instead caching allocated pages, and allocating within them yourself.
- Object allocation is fast, but provided data-structures require locks. Access to lists and balanced binary trees is great, but the lock requirement requires careful design to achieve scalability.
- Compatibility is a big limiting factor here. Nothing here exists before 6.2, arenas before 6.9 -- and the lock (and thus
bpf_list/bpf_rbtree) is unavailable inkprobeand tracepoint programs, leavingfentryas the only tracing hook that can use them.
Compatibility and configuration flags
Last, something more mundane, but equally important: configuration management. eBPF has many useful utilities, but they are often gated behind a wide variety of kernel versions. This means that eBPF code typically must be configurable to the kernel version and environment of a specific production machine. Doing all of this at compile time (with #ifdef-hell) can be cumbersome. Luckily eBPF provides reasonable means to do this at eBPF program load time.
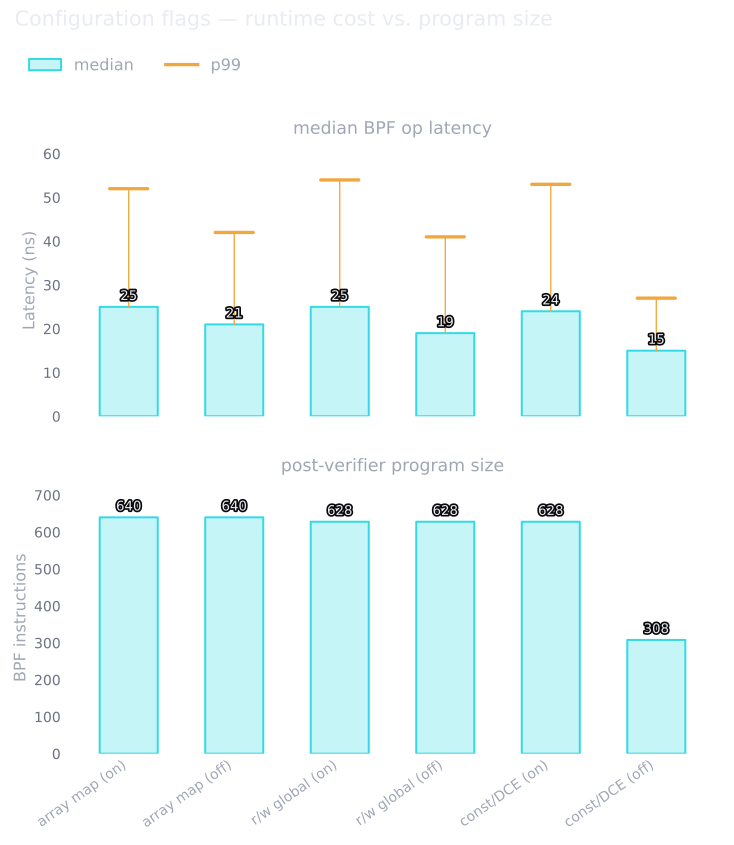
Using a read-only map, and configuring its contents before loading the eBPF program does something fantastic. It drives the Dead-Code Elimination (DCE) pass of the verifier to generate efficient code specific to that configuration. We can see this in the overheads. We compare against storing the configuration in an RW array map, or in a global variable (which is transparently backed by an array map). When the feature is turned "on", all approaches have comparable overhead. But when the feature is turned "off", the DCE approach achieves the lowest overhead as the code is effectively generated with no conditions! On the right, we can see that DCE also ends up shrinking the program size which massively aids in verification (see this space in the future).
Go Forth and eBPF Wisely!
While there are many additional abstractions and helper functions exposed to eBPF, these often form the core. The challenge is optimizing the actual eBPF code to be both fast and resource efficient while still passing the verifier. Put another way: eBPF is a deep, awesome rabbit hole. We're trying to wring every capability and cycle out of it at Bitbison -- we likely are among the use-cases with the highest event throughputs! Watch this space for more.
Verification does quite a bit more, but for the purposes of our discussion, I'm simplifying here. The kernel's verifier documentation has the gory details, this paper gives a formal treatment of the problem, and this one looks at verifying the functional behavior of eBPF programs themselves. ↩︎
The constraint is actually even more restrictive. These actually must be wait-free to guarantee that each eBPF program has a bounded number of execution steps! ↩︎
In the delay variant, we actually do eagerly enqueue once out of 4096 enqueue operations to ensure that we deliver the notification at some point. ↩︎
One wrinkle: with nodes recycled through push/pop cycles on every core, the textbook Treiber stack corrupts itself via ABA, and eBPF has no double-width CAS for the usual tagged-pointer fix. An arena pointer only needs 32 bits (they are limited to 4GB), so the stack head packs {tag:32, offset:32} into a single CAS-able word. ↩︎